
The Enterprise Graph: The Missing Layer in Your AI Stack
Most AI projects fail before they start — here’s why

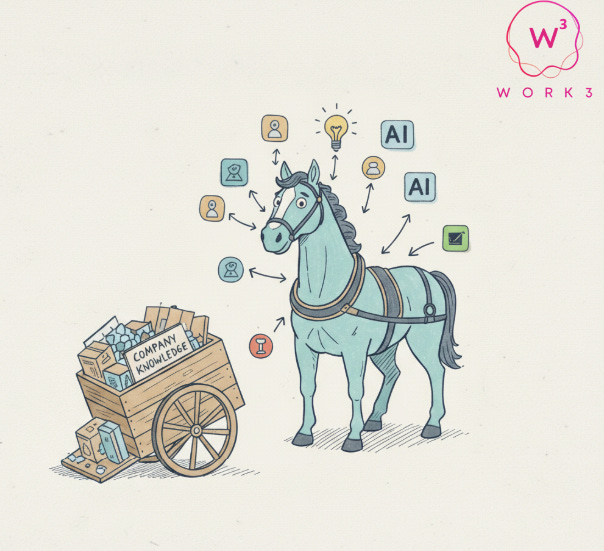
In Italy we say: “non mettere il carro davanti ai buoi” — don’t put the cart before the horse.
In the enterprise, the “cart” is the company’s knowledge — organized and mapped in what we call the Enterprise Graph. The “horse” is AI, pulling that knowledge forward. Without the graph, the horse is powerful but directionless.
This is why AI assistants and agents, despite their promise, stumble on the basics of daily work. Who owns this process? Which document is the latest? What decision did we make last sprint? These aren’t edge cases — they’re the fabric of everyday work, and the place where most AI fails. Not because the models are weak, but because organizations haven’t mapped their knowledge.
Until knowledge is treated as capital — invested, structured, and maintained — AI in the workplace won’t reach its full potential.
The Real Hard Part
Most of the talk right now is about model size, benchmarks, and prompts. But inside companies, the bottleneck is fractured knowledge:
Project specs in Confluence
Customer notes in Salesforce
Decisions buried in Slack
Owners changing faster than docs
An agent asked to help is like someone given a box of puzzle pieces without the picture on the lid: the pieces exist, but the context is missing — and without that, agents end up shallow, no matter how advanced the technology.
Work itself is also shifting: as argued in The Decentralised Workforce, teams are more fluid, roles flex constantly, and information scatters across hundreds of apps. AI doesn’t fix that. It can even amplify what Luca described in his article on cognitive debt: the hidden cost of fragmented knowledge and half-finished systems.
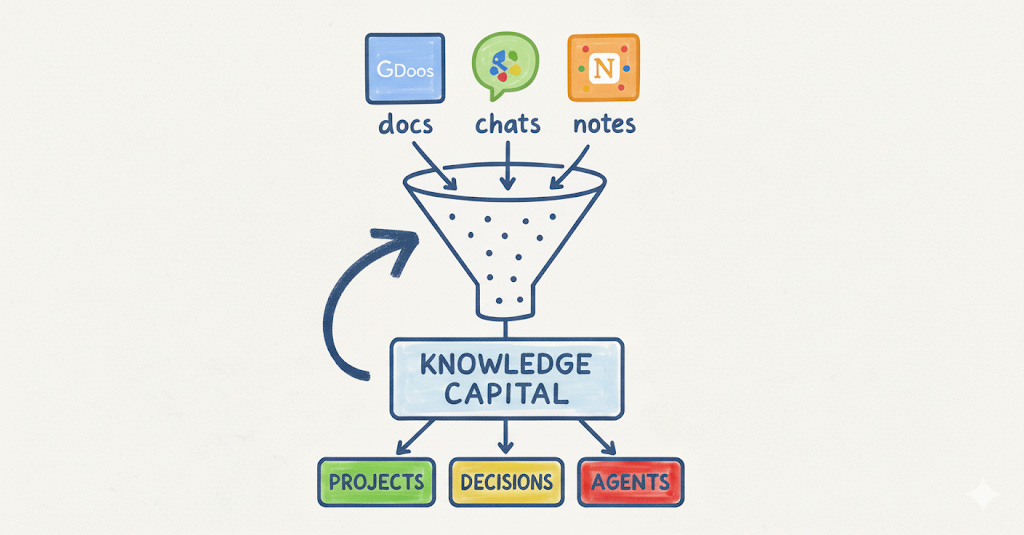
Knowledge as Capital
Knowledge is the lifeblood of organizations. But if it’s scattered, undocumented, or stuck in someone’s head, it isn’t usable — and it depreciates with time.
Knowledge capital = what your company knows, and how easily that knowledge can be applied. Traditionally it spans:
Human capital → skills and know-how
Structural capital → processes, systems, IP
Relational capital → connections to customers and partners
Especially in an age where information has become abundant and cheap — it’s knowledge, the ability to turn information into decisions, that generates advantage (for more on this topic, check out the book Knowledge Capital: Organizational Discretional Intellectual Capital). So treating information as a portfolio (not just a pile of documents) is what can turn it into a productivity and competitive advantage.
Like financial capital, knowledge capital has returns and risks:
Returns → faster onboarding, quicker decisions, less duplication, better outcomes when context moves with the work
Risks → obsolescence, drift, fragmentation; knowledge that isn’t refreshed has a half-life
This is why it calls for a concept like knowledge debt to be measured and introduced. Just as engineers talk about technical debt, organizations accumulate knowledge debt — shortcuts and gaps that feel efficient in the moment but create downstream costs. AI can make things worse and amplify that debt: shifting teams into “review mode” (quick edits on AI drafts) risks anchoring thinking unless the underlying context is sound.
So to act like real capital, knowledge must be:
Structured over stored → map relationships (owners, dependencies, freshness) instead of piling up files
Measured by quality, not quantity → freshness, usage, and authority signals matter more than raw volume
Deliberately transferred → role changes and handoffs should be designed processes, not ad-hoc chases
The Enterprise Graph - Capturing and Using Knowledge Capital
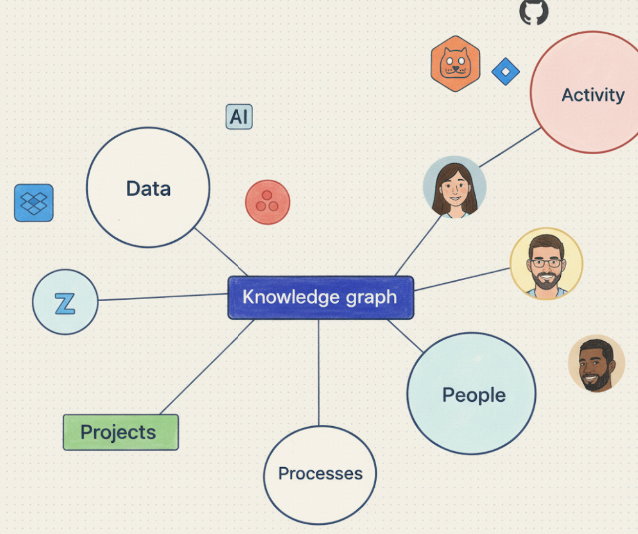
To do this, we need to introduce the enterprise graph. This will act as the organizational nervous system that makes knowledge capital usable:
Nodes → people, projects, documents, systems
Edges → who collaborated, what depends on what, when it happened
Together they form a living map of how work actually happens — updating as projects shift, collaborators change, and tools evolve.
📍 Example: feature request triage in Jira
Before → A PM is triaging tickets, checking for duplicates, pinging engineers on Slack, and updating statuses manually
With the graph → An agent sees duplicates instantly, because the graph links related tickets, past Slack decisions, and GitHub commits. It updates statuses automatically, flags dependencies, and routes edge cases to the right owner
The result: context surfaces where and where work is happening and can be used to feed assistants, decisions, and build agents that have the right information at hand.
Once we build the map (the graph), we need to give agents a way to act. That’s where Model Context Protocol (MCP) comes in. It’s quickly emerging as the standard that lets agents interact with enterprise tools through a common client–server pattern.
Instead of one-off integrations, MCP defines simple calls: agents act as clients, systems expose capabilities (search, retrieve, update). This is the way that the various
Of course a lot of questions remain — what tools to expose, how to govern permissions, but this could become one of the new types of tasks/roles that can be created to help facilitate and coordinate implementation and evolution of the graph.
But who Gets to Use It?
Another big problem of AI (just like any technology) is adaptation and accessibility: the real opportunity is when both engineers and non-engineers can build and use them.
For example: when accessible, HR can build an onboarding assistant, Ops can track workflows, Sales can fork a forecast bot. Engineers stop being the bottleneck, and teams closest to the work design the agents they need.
This mirrors what already happened with AI writing tools: they don’t just generate text, they guide clarity and tone. Agent builders need to do the same — helping non-engineers shape workflows without learning query languages. As argued in What’s Good for Humans is Good for AI, this is the only way agents can scale and enable further personalization of any solution.
Implementation Reality: How to Implement the Enterprise Graph
To build the enterprise graph we need to think of a staged rollout, where value comes from proving usefulness early and layering complexity over time.
This could look like a 90-day plan:
30 days — Pilot where knowledge debt hurts most
Start with a narrow use case (onboarding, support, project tracking)
Connect 3–5 core systems
Index metadata (ownership, freshness, dependencies) not just content
Map one workflow end-to-end to show how context follows work
60 days — Expand across teams and signals
Add more systems and governance signals:
Freshness → % of docs verified/updated in 90 days
Usage → % of indexed knowledge referenced in work
Authority → % of assets with clear ownership
Layer simple agent actions (deduplicate tickets, flag canonical docs)
Enforce role-based permissions from source systems
90 days — Scale with accessibility and monitoring
Embed graph context in daily tools (chat, IDEs, dashboards)
Provide low-code builders so non-engineers can create agents
Monitor graph health (coverage, freshness rates, workflow adoption)
Define compliance boundaries early (what’s in scope vs. off-limits)
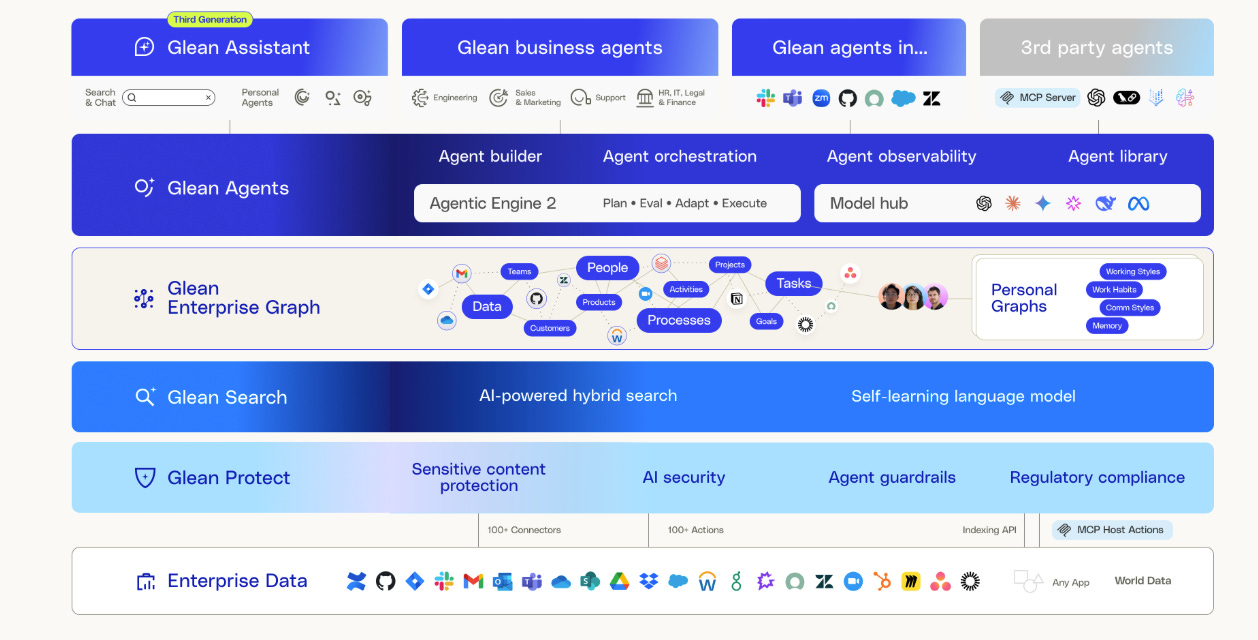
This is where a tool like Glean, a Work AI platform that is trying to solve this - can help. At its core, it has the Enterprise Graph and Personal Graphs (same concept, applied to the individual level to learn about your tasks and style) - on top of which functional layers like Search, Agents and Assistants are built.
Clearly this is a solution that gets most value for mid to large enterprises (given its focus also on security, compliance) but it should increasingly become a standard layer for new and AI native organizations.
Final Thoughts
We already discussed at length how AI shouldn’t be seen as another tool, but a good excuse and technology that helps us rethink how we work — what patterns we reward, how teams learn, how decisions flow. In medium and large organizations, fragmentation and dispersion are the norm everyday bottlenecks. No model will fix that until the infrastructure of work changes.
We need to design systems that mirror or capture real human workflows: messy, adaptive, intertwined. The enterprise graph is one foundational move toward that as it starts making context durable, shareable, and actionable across domains.
That’s when we gain visibility not only into what teams do, but how they do it, and this matters not only for individuals, but also for team performance. In “There’s No AI in Team” we discussed that AI can’t substitute trust and alignment but that it can enforce consistency, detect drift, highlight gaps, and even surface invisible dependencies before they trip someone up. In that environment, performance becomes not just a reflection of good tools, but of shared structure.
If we treat knowledge capital as something we invest in — design, measure, maintain — and not just as “data to feed models” we can start evolving new forms of work and coordination.
💡 This issue is supported by Glean, who are building an enterprise graph to unify 100+ SaaS systems and a conversational agent builder on top of it. If you are interested in knowing more and how developers are building on the platform, make sure to chek them out.